Transit Police continue to target BIPOC people
Metro Vancouver’s Transit Police have always targeted BIPOC people, in particular Black and Indigenous people. This post summarizes FOI data from 15 years of Transit Police street checks and seven years of Transit Police general occurrence reports. The datasets are available at the bottom of this post.
Transit Police street checks
In the five years before B.C. police distanced themselves from the term “street checks,” 16.1% of Transit Police street checks were officers stopping Indigenous people, despite Indigenous people making up only 2.5% of Metro Vancouver’s population. In the same time period, 5.2% of the Transit Police’s street checks were officers stopping Black people, despite Black people making up only 1.2% of the population.

Those numbers only confirm what we already know. It is not breaking news that Transit Police target and harm BIPOC people. In 2011, for example, Transit Police assaulted a Black UBC student. That year, 6.1% of their street checks were Black people, despite making up only 1% of Metro Vancouver’s population.
In 2014, Transit Police killed Naverone Woods while he was in crisis. That year, Indigenous people made up 2.9% of the population but were 17.4% of people Transit Police street checked. Transit Police used guns to threaten 47 people in 2020, the most recent year for which data is available, including at least seven people in crisis.
In 2013, Transit Police detained Lucía Vega Jiménez over a $2.75 fare, and questioned her status because of her accent. She died by suicide in CBSA custody. That year, Hispanic people made up 1.3% of the population but 2.7% of Transit Police street checks. While I requested intersectional street check data (e.g. the number of Hispanic women street checked), the Transit Police did not release that information.
Transit Police Chief Dave Jones says some of their fare enforcement used to be categorized as street checks.
Transit Police general occurrence reports
Street check numbers fell in 2020 after public criticism led to new rules from the government, which narrowly define what constitutes a street check. Some of those stops may now be happening off the books. When asked to explain the drop, Chief Jones said the reasons included: a reduction in street checks; a change in “tactics”; and also shifting stops that used to be recorded in street check reports to general occurrence reports. Those reports also show Transit Police targeting BIPOC people.
For example, in 2021 and 2022, despite being 1.6% of the population, Black people were 9.3% of people assigned the role “Charged” in Transit Police general occurrence reports and 9.1% of people the Transit Police said were “Chargeable.” Indigenous people were 2.4% of the population but 16% of people the Transit Police labeled charged or chargeable.

Between 2016 and 2020, Transit Police were 7.8 times and 5.2 times as likely to list Black and Indigenous people as “Of Interest” in their reports as white people. Transit Police also labeled Black and Indigenous people as 8.9% and 12.3% of their “Suspects,” respectively, despite making up 1.2% and 2.5% of the population. Statistics from Toronto also found Indigenous and Black people are “grossly overrepresented” in transit police enforcement.

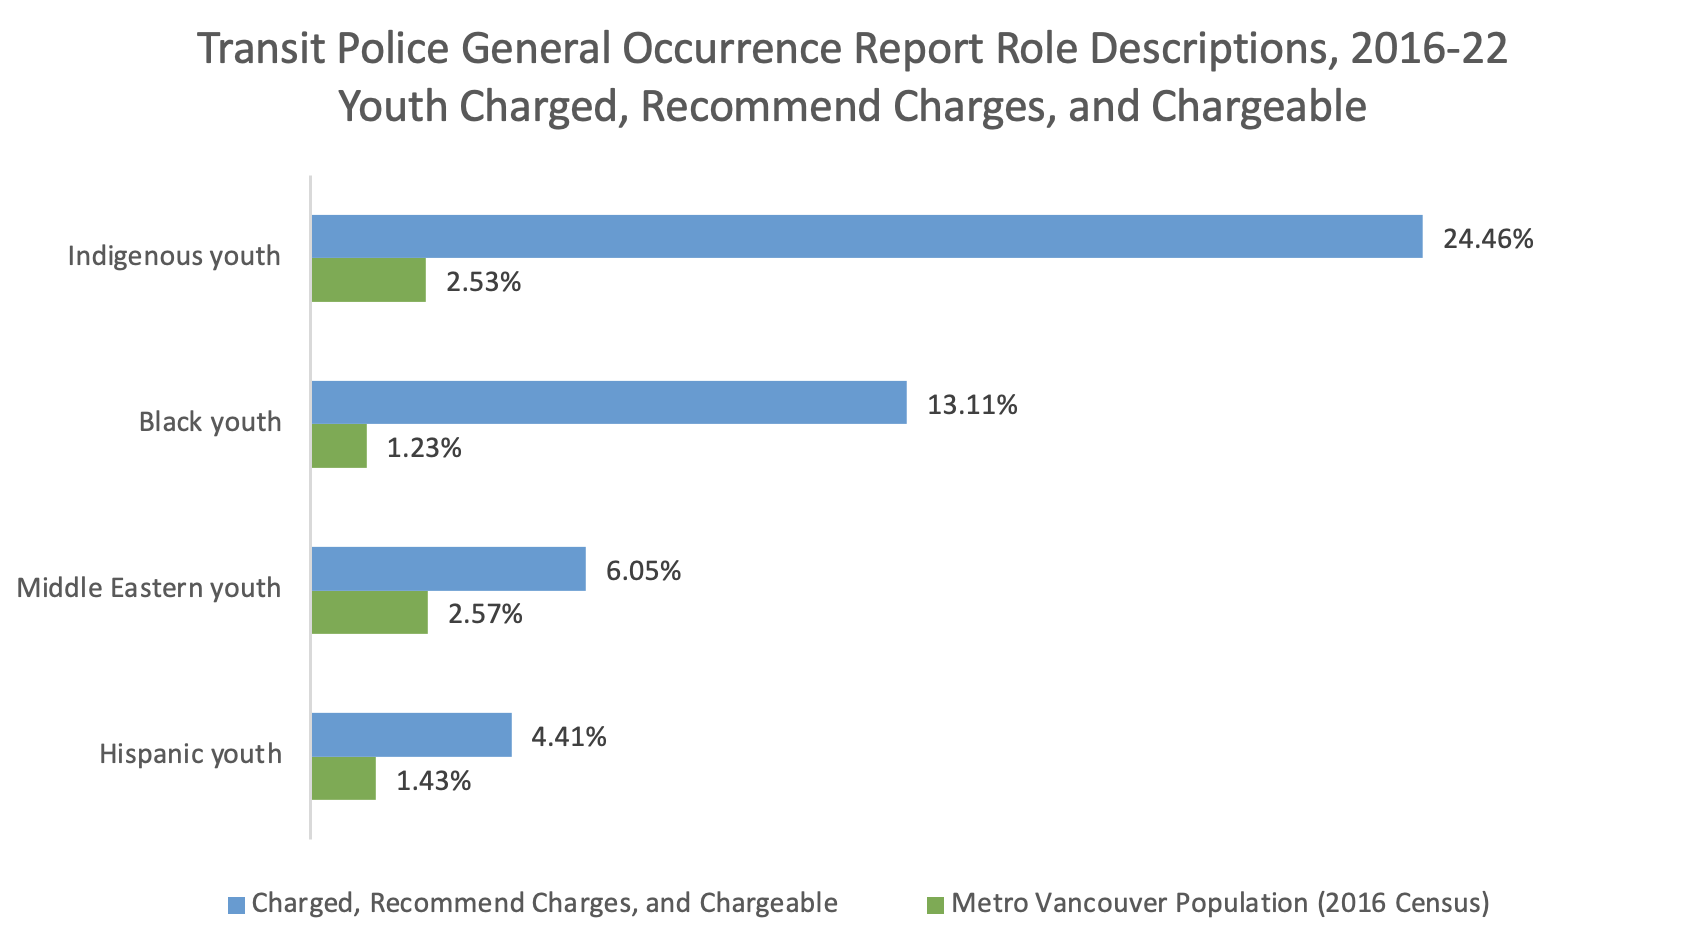
Metro Vancouver’s Transit Police also target BIPOC kids. From 2016 to 2022, out of all kids either charged after an interaction with the Transit Police, kids who the Transit Police recommended charges against, and kids who they labeled chargeable, 13.1% were Black (1.2% of the population in 2016), 24.5% were Indigenous (2.5% of the population), 6.1% were Middle Eastern (2.6% of the population), and 4.4% were Hispanic (1.4% of the population).
Transit Police also police poverty, and many of the statistics above intersect with the fact that BIPOC people are disproportionately homeless. Municipalities continue to try to displace and arrest away visible poverty instead of meaningfully funding housing and services. See this analysis by Stanley Q. Woodvine on the intersection of the Vancouver Police Department’s street check statistics with policing poverty.
Transit Police don’t just police people on TransLink property, and their general occurrence reports also show they disproportionately stop BIPOC drivers. In the last seven years, 2.9% of drivers in their reports were Black (1.2% population in 2016); 2.8% were Hispanic (1.4% population); 4.6% were Middle Eastern (2.6% population); and 20.1% were South Asian (12% population). These figures exclude drivers they labeled charged, chargeable, or who they recommended charges against.

Transit Police statistics for people assigned “Driver” and “Passenger” role descriptions, 2016 to 2022.
TransLink’s draft 2023 budget included $53 million for transit police, up 14% from the previous year. Police forces in B.C. all uphold systemic racism, but Transit Police have the unique distinction of being the only force in the country to explicitly approve wearing thin blue line patches. Funding any police force in B.C., including the Transit Police, means funding an agency that targets, arrests and harms BIPOC people every day as part of its core function.

Screenshot of a Transit Police Board report describing its “thin blue line” policy as of June 10, 2022. Source.
Download Transit Police general occurrence report ethnicity data, 2016-2022. Spreadsheet includes summary data; individual pivot tables for 2016-20 and 2021-22 due to different census population data; a pivot table for 2016-2022 without census data; Metro Vancouver census information; and information on “role descriptions.” The original data is also available here.
Download Transit Police street check data, 2008-2022. Spreadsheet includes summary data; Metro Vancouver census information; information on “role descriptions”; and a spreadsheet version of the data provided by the Transit Police, including “reason,” “district,” “gender,” and “ethnicity” statistics. The original PDF provided by the Transit Police is available here.
General occurrence report data for B.C.’s municipal police departments can be found here.